Topography workflow#
The topo workflow of xDEM performs a topographical summary of an elevation dataset.
This summary derives a series of terrain attributes (e.g. slope, hillshade, aspect, etc.) with statistics (e.g. mean, max, min, etc.).
Caution
This workflow is still in development and its interface may thus change rapidly. It currently includes only classical terrain attributes.
Basic usage#
Below is an example of basic usage for the topo workflow, including how to build your configuration file, and how to run xdem topo and interpret its logging output and report.
Configuration file#
The configuration file of the topo workflow contains four categories: inputs, outputs, statistics and terrain_attributes.
Only the path to the elevation dataset in the inputs section is a required parameter. All others can be left out, in which case they default to pre-defined parameters.
By default, the topo workflow derives slope, aspect and max. curvature, computes 15 different statistics, and saves level-1 (intermediate) outputs in ./outputs .
In the example of configuration file below, we define:
The path to the elevation dataset which is required,
The path to a mask, to exclude terrain during the analysis,
The path to an output directory where the results will be written,
The specific list of terrain attributes to derive,
The specific list of statistics to compute after/before coregistration.
inputs:
  reference_elev:
    path_to_elev: "../../../xdem/example_data/Longyearbyen/data/DEM_2009_ref.tif"
    path_to_mask: "../../../xdem/example_data/Longyearbyen/data/glacier_mask/CryoClim_GAO_SJ_1990.shp"
outputs:
  path: "outputs_topo"
statistics:
- median
- nmad
- validcount
terrain_attributes:
- hillshade
- slope
- aspect
- max_curvature
- roughness
- rugosity
For details on the individual parameters, see Configuration parameters further below. For generic information on the YAML configuration file, see the Command line interface page.
Tip
To display a template of all available configuration options for the YAML file, use the --template-config argument
Running the workflow#
Now that we have this configuration file, we run the workflow.
!xdem topo --config topo_config.yaml
The logging output is printed in the terminal, showing the different steps.
Finally, a report is created (both in HTML and PDF formats) in the output directory.
We can visualize the report of our workflow above:
Workflow details#
This section describes in detail the steps for the topo workflow, including a summary chart and all parameters of its CLI interface.
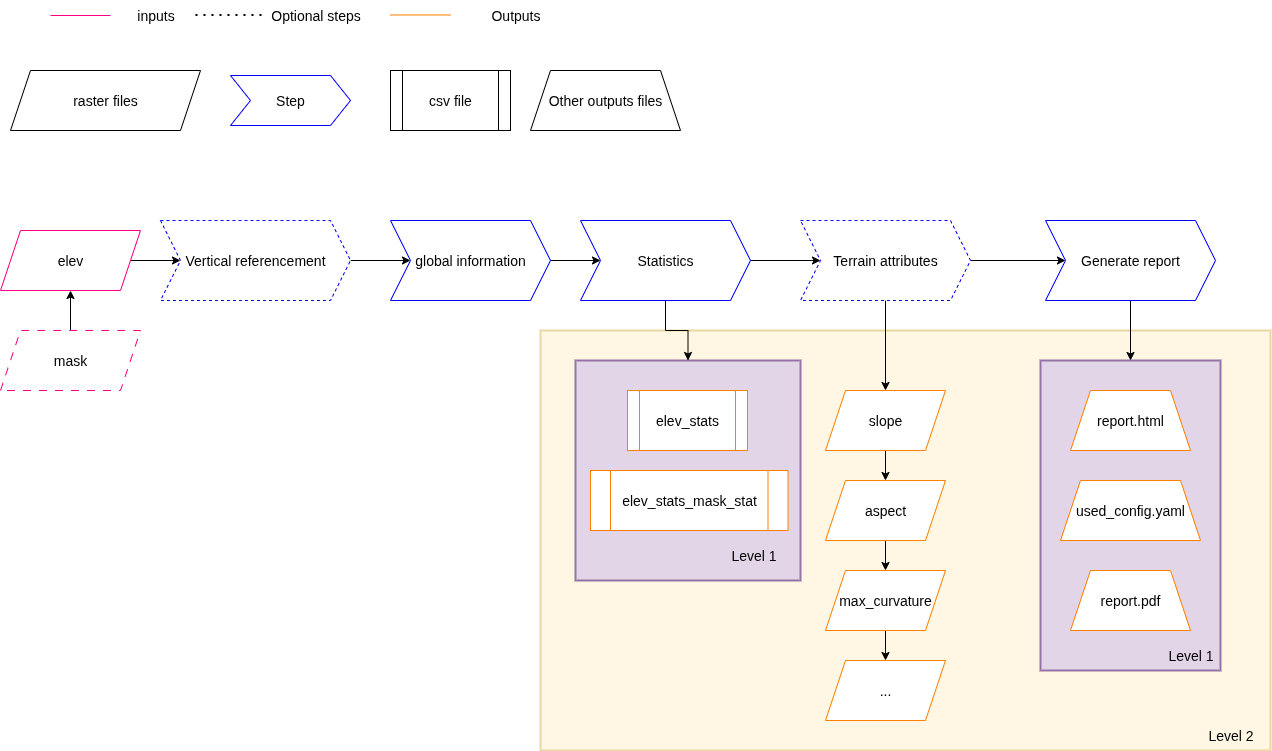
Chart of steps#
The topo workflow, including its inputs, outputs, processing steps and output detail level, are described on the following chart:
Configuration parameters#
The parameters to pass to the topo workflow are divided into four categories:
The
inputsdefine file opening and pre-processing, including one required path to elevation data, but also optional masking, CRS, nodata over-riding, and downsampling factor,The
outputsdefine file writing and report generation, with various levels of detail for the produced outputs,The
terrain_attributesdefine steps for coregistration, directly interfacing with the Terrain attributes module of xDEM,The
statisticsdefine steps for computing statistics before/after coregistration, directly interfacing with the Statistics module of GeoUtils.
These categories and detailed parameter values are further detailed below:
Required: Yes
Elevation input information.
Name |
Description |
Type |
Default |
Required |
|---|---|---|---|---|
|
Path to reference elevation |
str |
Yes |
|
|
No data elevation |
int |
No |
|
|
Path to mask associated to the elevation |
str |
No |
|
|
Original vcrs |
int, str |
|
No |
|
Destination vcrs |
int, str |
|
No |
|
Downsampling elevation factor >= 1 |
int, float |
1 |
No |
Note
For transforming between vertical CRS with from_vcrs/to_vcrs please refer to Vertical referencing.
The downsample parameter allows the user to resample the elevation by a round factor.
The default value of 1 means no downsampling.
And, if you want to test the CLI with xDEM example data, they can also refer to data alias. Please refer to data-example to have more information.
inputs:
  reference_elev:
    path_to_elev: "path_to/reference_elev.tif"
    force_source_nodata: -32768
    from_vcrs: null
    to_vcrs: null
Note
The null and None values are both accepted in YAML files, which correspond to None in the Python API.
Required: No
Statistics step information. This section relates to the computed statistics:
If no block is specified, all available statistics are calculated by default: [mean, median, max, min, sum, sum of squares, 90th percentile, LE90, nmad, rmse, std, valid count, total count, percentage valid points, inter quartile range]
If a block is specified but no statistics are provided, then no statistics will be computed.
If a block is specified and some statistics are provided, then only these statistics are computed.
statistics:
  - min
  - max
  - mean
If a mask is provided, the statistics are also computed inside the mask.
Required: No
List or set of dictionaries for extra information.
Note
If no block is specified, slope, aspect, and curvature attributes are calculated by default.
If a block is specified but no information is provided, then no attributes will be calculated.
terrain_attributes:
  - hillshade
  - slope
or
terrain_attributes:
  hillshade:
      extra_information:
  slope:
      extra_information:
  aspect:
      extra_information:
          degrees: False
Note
The data provided in extra_information is not checked for errors before executing the code. Its use is entirely the responsibility of the user.
Required: No
Outputs information. Operates by levels:
Level 1 → aligned elevation only
Level 2 → more detailed output
Name |
Description |
Type |
Default value |
Available Value |
Required |
|---|---|---|---|---|---|
|
Path for outputs |
str |
outputs |
No |
|
|
Level for detailed outputs |
int |
1 |
1 or 2 |
No |
outputs:
  level: 1
  path: "path_to/outputs"
Tree of outputs for level 1:
- root
  ├─ tables
  │   ├─ elev_stats.csv
  │   └─ elev_with_mask_stats.csv
  ├─ plots
  │   ├─ elev_map.png
  │   ├─ masked_elev_map.png (if mask_elev is given in input)
  │   └─ terrain_attributes_map.png
  ├─ rasters
  ├─ report.html
  ├─ report.pdf
  └─ used_config.yaml
Tree of outputs for level 2:
- root
  ├─ tables
  │   ├─ elev_stats.csv
  │   └─ elev_with_mask_stats.csv
  ├─ plots
  │   ├─ elev_map.png
  │   ├─ masked_elev_map.png (if mask_elev is given in input)
  │   └─ terrain_attributes_map.png
  ├─ rasters
  │   ├─ aspect.tif
  │   ├─ curvature.tif
  │   ├─ hillshade.tif
  │   ├─ rugosity.tif
  │   ├─ slope.tif
  │   ├─ terrain_ruggedness_index.tif
  │   └─ ...
  ├─ report.html
  ├─ report.pdf
  └─ used_config.yaml