Note
Go to the end to download the full example code.
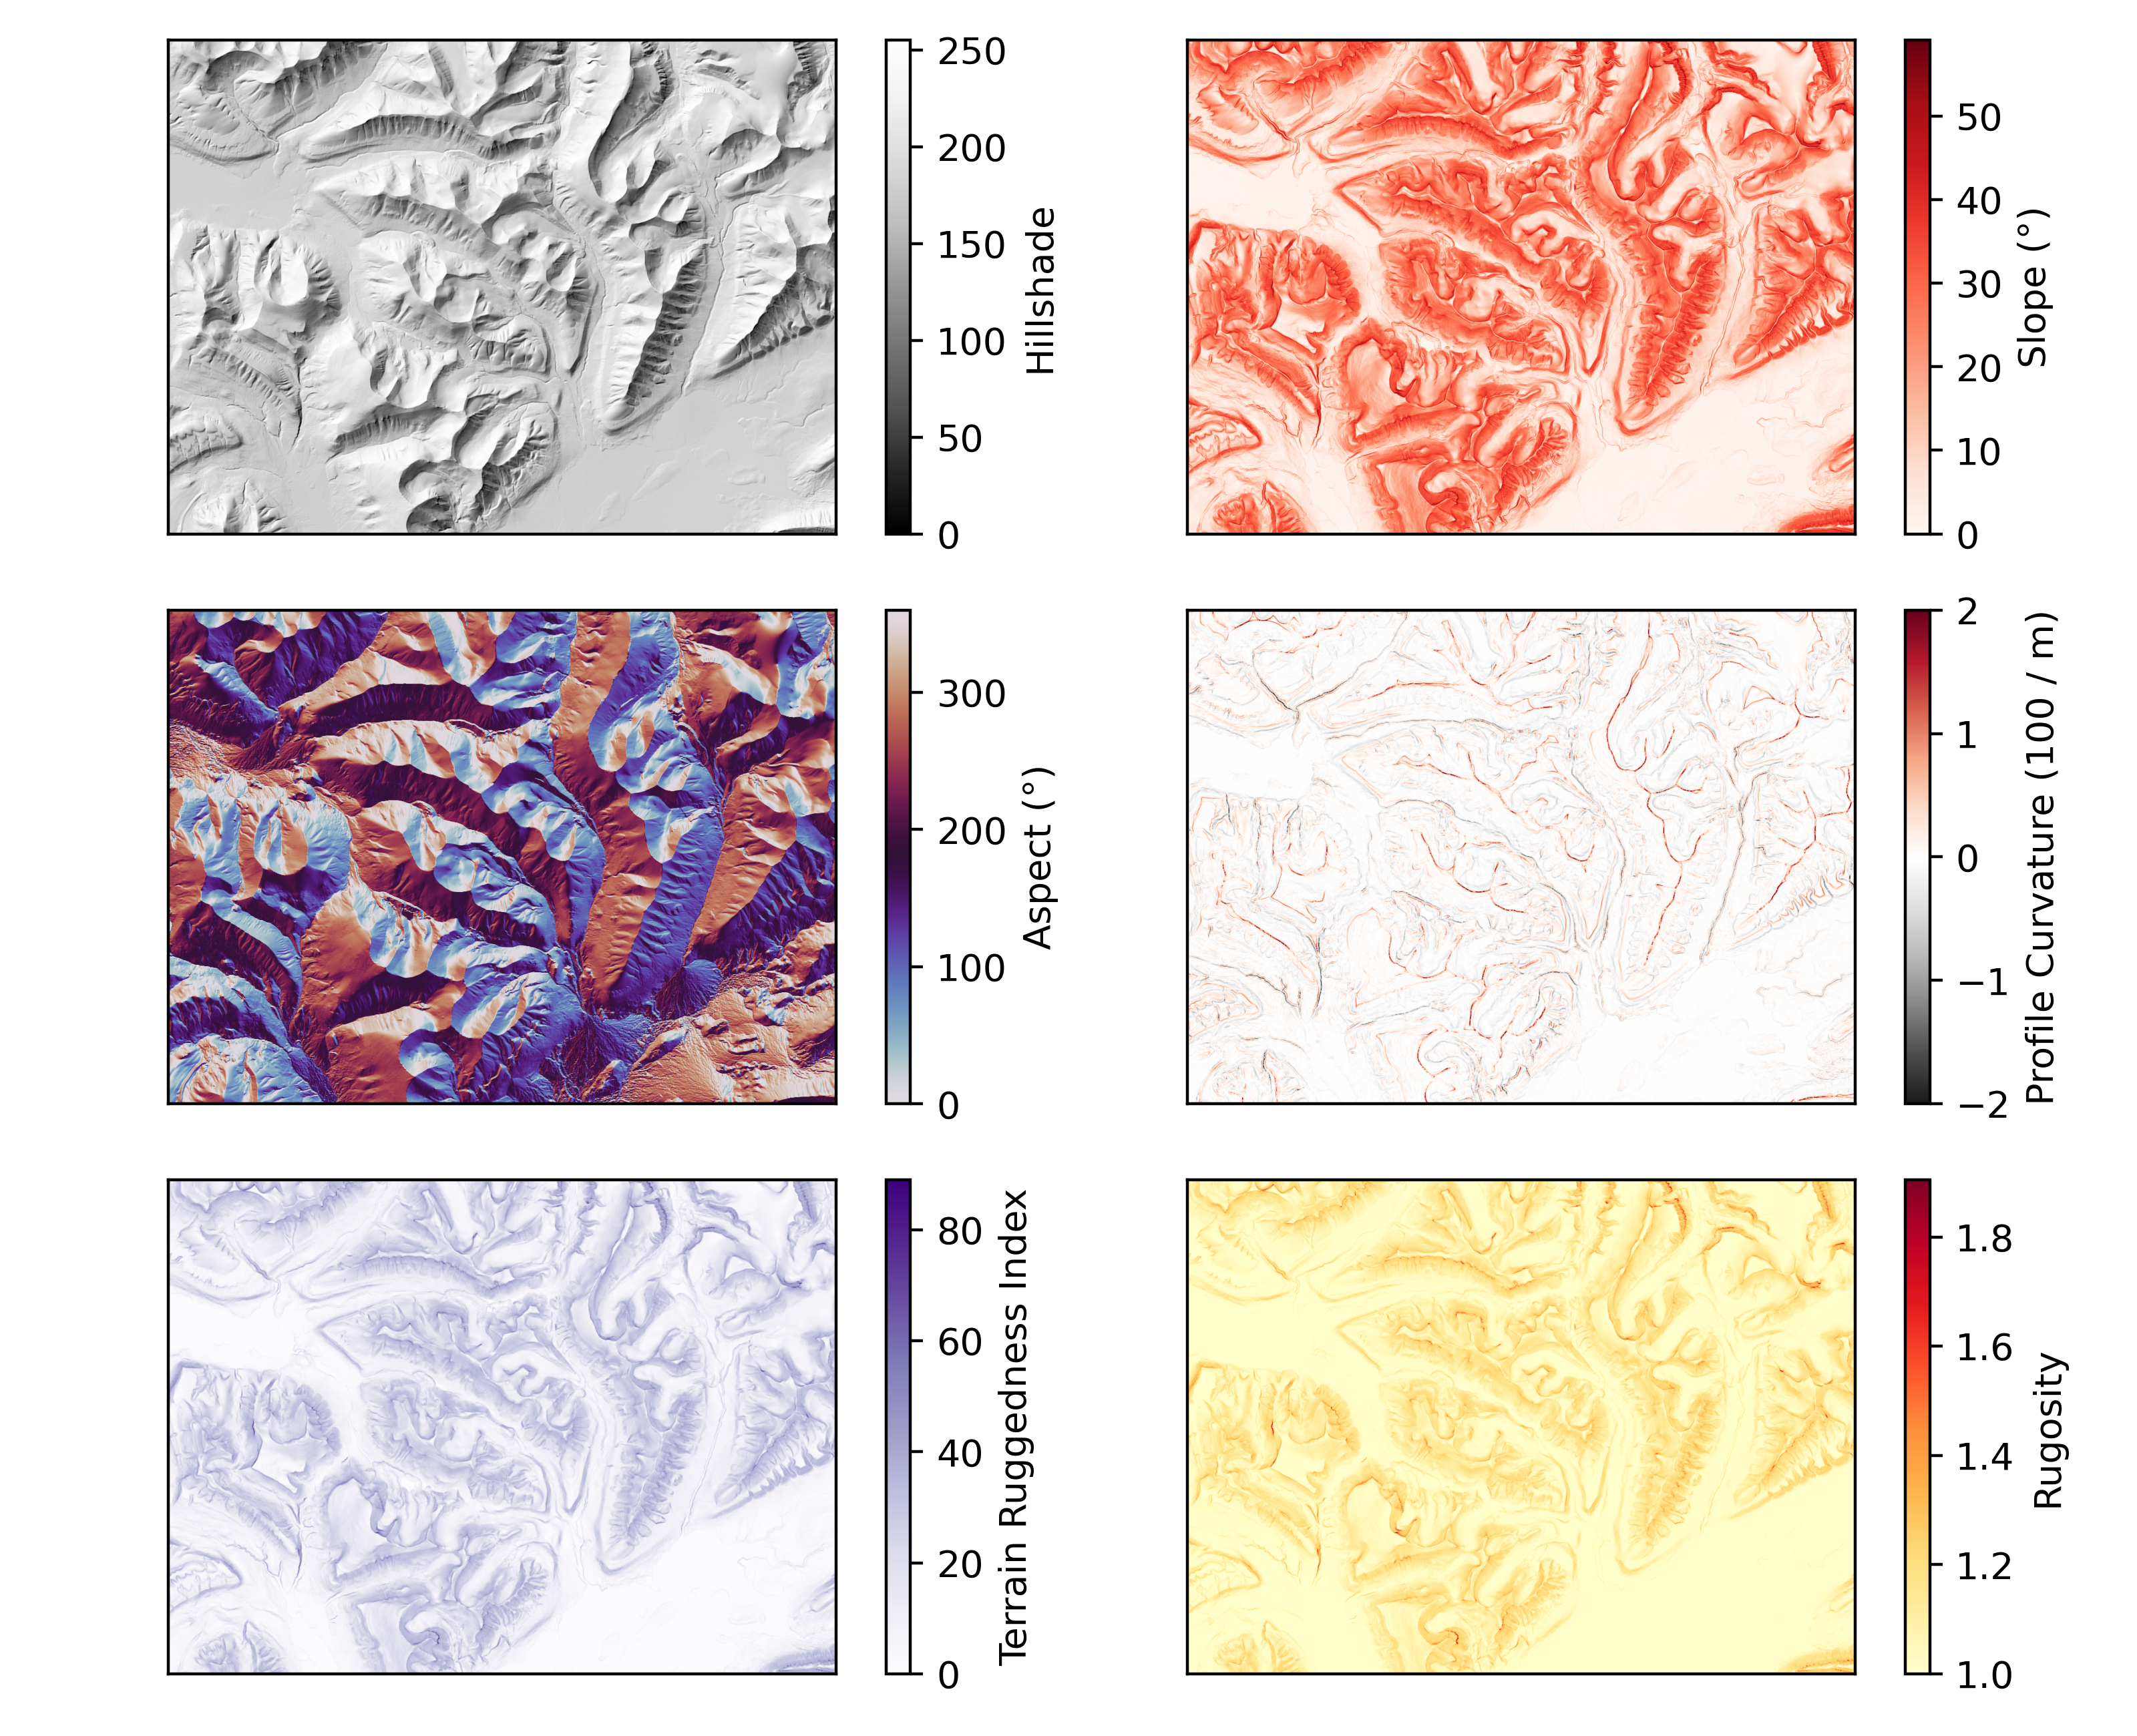
Terrain attributes#
Terrain attributes generated from a DEM have a multitude of uses for analytic and visual purposes. Here is an example of how to generate these products.
As a reminder: the slope, aspect, and hillshade are calculated following Horn (1981); the system of curvatures follows that described by Minár et al. (2020)l and the terrain ruggedness index and rugosity follow Riley et al. (1999) and Jenness (2004), respectively. For more information, see the Terrain attributes feature page.
References: Horn (1981) (slope, aspect, hillshade), Minár et al. (2020) (curvature), Riley et al. (1999) (terrain ruggedness index), Jenness (2004) (rugosity).
import matplotlib.pyplot as plt

import xdem
We load the example data.
We generate multiple terrain attribute at once (more efficient computationally as some depend on each other).
attributes = xdem.terrain.get_terrain_attribute(
    dem.data,
    resolution=dem.res,
    attribute=["hillshade", "slope", "aspect", "profile_curvature", "terrain_ruggedness_index", "rugosity"],
)

plt.figure(figsize=(8, 6.5))

plt_extent = [dem.bounds.left, dem.bounds.right, dem.bounds.bottom, dem.bounds.top]

cmaps = ["Greys_r", "Reds", "twilight", "RdGy_r", "Purples", "YlOrRd"]
labels = ["Hillshade", "Slope (°)", "Aspect (°)", "Profile Curvature (100 / m)", "Terrain Ruggedness Index", "Rugosity"]
vlims = [(None, None) for i in range(6)]
vlims[3] = [-2, 2]

for i in range(6):
    plt.subplot(3, 2, i + 1)
    plt.imshow(attributes[i].squeeze(), cmap=cmaps[i], extent=plt_extent, vmin=vlims[i][0], vmax=vlims[i][1])
    cbar = plt.colorbar()
    cbar.set_label(labels[i])
    plt.xticks([])
    plt.yticks([])

plt.tight_layout()
plt.show()
Total running time of the script: (0 minutes 2.589 seconds)